Each summer the Platte River Recovery Implementation Program (Program) and its partners survey the river and off-channel nesting habitat to document least tern and piping plover abundance and productivity within the Associated Habitat Area (AHR) for the Program. Monitoring typically occurs from 1 May – 1 August; however, the monitoring season has been extended when least terns or piping plovers are known to be within the AHR outside of this range of dates.
Similar to previous years, there was a good distribution of nests across off-channel sand and water (OCSW) and sandpit sites throughout the AHR, but no in-channel nesting was observed during 2019. The number of breeding pairs observed during 2019 was high and comparable to other years that the Program did not add any more off-channel nesting habitat. This season was a moderately successful year for least tern nests as 51% (67 of 132) of least tern nests hatched. Piping plover nests were moderately successful as well with 52% (31 of 60) of nests hatching. However, chick success for both species was poor, largely due to predation and major flooding, both factors that also affected nest success. The overall fledge ratio for least terns was 0.75 fledglings per breeding pair, which was an all-time low since 2007. Piping Plovers had an overall fledge ratio of 0.67 fledglings per breeding pair in 2019, which was slightly higher than in 2018.
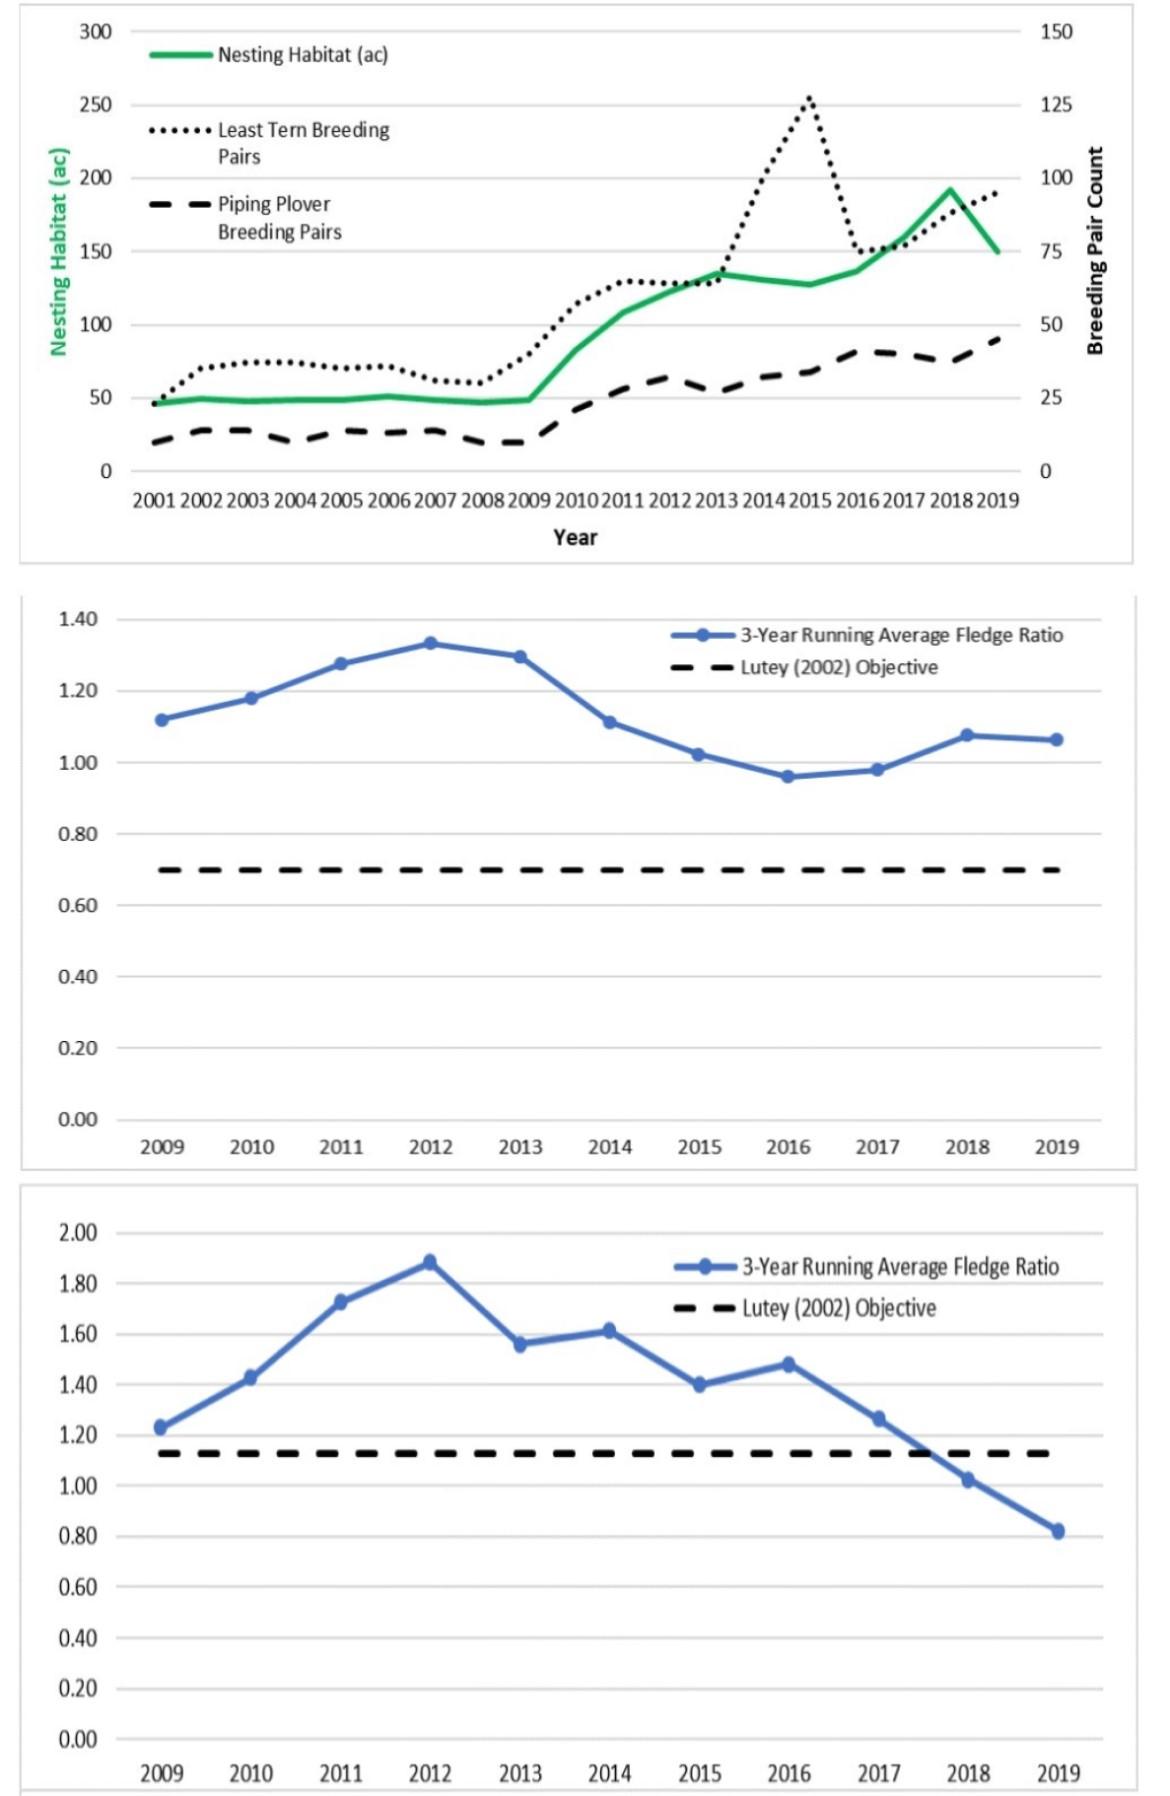
Breeding pair counts for both species have increased steadily since 2009 when the Program began acquiring and restoring off-channel nesting sites (top plot). Fledge ratios for least terns (middle plot) were at an all-time low during 2019. The plots show a 3-year running average that smooths out the curve, allowing us to better observe trends, so this all-time low is not visible in the plot. Piping plover fledge ratios have shown a decline in the past few years, though their fledge ratio for 2019 was slightly higher than in 2018 (bottom plot). Once again, this is not obvious in the plot as it represents a running average.