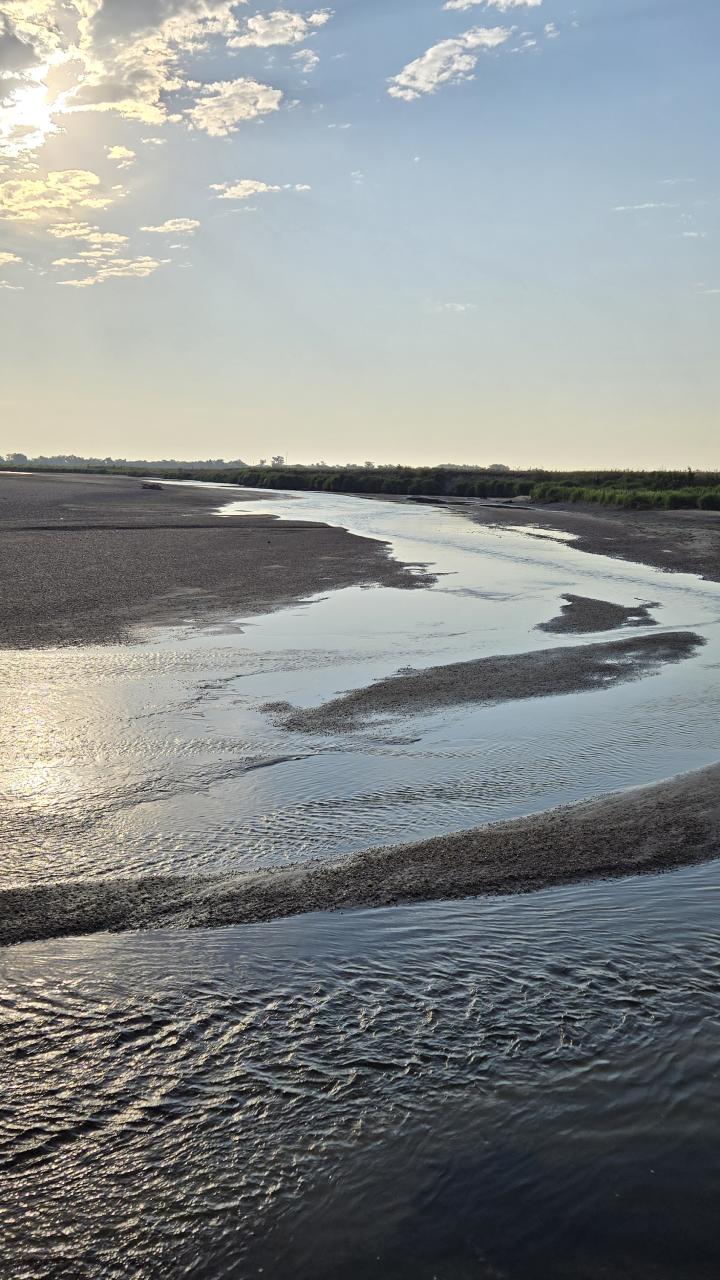
Hydrologic conditions

One of the goals of the Program is to achieve target flows based on the current hydrologic condition of the Platte River. This hydrologic condition is calculated using a formula contained in the Program's Water Plan.

For more information, see these documents:


December 2024-February 2025

Report period

December 1, 2024 - February 28, 2025


Normal

Target Flows

  • December 1 - 31 : 1000 CFS
  • January 1 - 31 : 1000 CFS
  • February 1 - 14 : 1800 CFS
  • February 15 - 28 : 3350 CFS
Hydrologic Conditions Index
0.30
October-November 2024

Report period

October 1 - November 30, 2024


Dry

Target Flows

  • October 1 - 31 : 1300 CFS
  • November 1 - 15 : 1300 CFS
  • November 16 - 30 : 600 CFS
Hydrologic Conditions Index
0.20

The Monthly Palmer Drought Severity Index (PDSI) values for September 2024 increased the calculated Hydrologic Conditions Index from 0.174 to 0.202 but the Final Hydrologic Condition remained "DRY" (HC Index < 0.25).

August-September 2024

Report period

August 1 - September 30, 2024


Dry

Target Flows

  • August 1 - 31 : 800 CFS
  • September 1 - 15 : 800 CFS
  • September 16 - 30 : 600 CFS
Hydrologic Conditions Index
0.23

The Monthly Palmer Drought Severity Index (PDSI) for July 2024 increased the calculated Hydrologic Conditions Index from 0.116 to 0.233 but the Final Hydrologic Condition remained "DRY" (HC Index < 0.29).

July 2024

Report period

July 1-31, 2024


Normal

Target Flows

  • July 1 - 31 : 1200 CFS
Hydrologic Conditions Index
0.31

The Monthly Palmer Drought Severity Index (PDSI) for June 2024 reduced the calculated Hydrologic Conditions Index from 0.460 to 0.310 but the Final Hydrologic Condition remained "NORMAL" (HC "DRY" only if HC Index < 0.31).

June 2024

Report period

June 1-30, 2024


Normal

Target Flows

  • June 1 - 20 : 3400 CFS
  • June 21 - 30 : 1200 CFS
Hydrologic Conditions Index
0.56

The Monthly Palmer Drought Severity Index (PDSI) for May 2024 reduced the calculated Hydrologic Conditions Index from 0.574 to 0.561 but the Final Hydrologic Condition remained "NORMAL" (HC Index between 0.3 and 0.7).

May 2024

Report period

May 1-31, 2024


Normal

Target Flows

  • May 1 - 10 : 2400 CFS
  • May 11 - 19 : 1200 CFS
  • May 20 - 26 : 3400 CFS
  • May 27 - 31 : 3400 CFS
Hydrologic Conditions Index
0.34
March-April 2024

Report period

March 1 - April 30, 2024


Normal

Target Flows

  • March 1 - 15 : 3350 CFS
  • March 16 - 22 : 1800 CFS
  • March 23 - 31 : 2400 CFS
  • April 1 - 30 : 2400 CFS
Hydrologic Conditions Index
0.64

The Monthly Palmer Drought Severity Index (PDSI) for February 2024 reduced the calculated Hydrologic Conditions Index from 0.788 to 0.640 but the Final Hydrologic Condition remained "NORMAL" (HC Index > 0.25).

December 2023-February 2024

Report period

December 1, 2023 - February 29, 2024


Normal

Target Flows

  • December 1 - 31 : 1000 CFS
  • January 1 - 31 : 1000 CFS
  • February 1 - 14 : 1800 CFS
  • February 15 - 29 : 3350 CFS
Hydrologic Conditions Index
0.49
October-November 2023

Report period

October 1 - November 30, 2023


Normal

Target Flows

  • October 1 - 31 : 1800 CFS
  • November 1 - 15 : 1800 CFS
  • November 16 - 30 : 1000 CFS
Hydrologic Conditions Index
0.51
August-September 2023

Report period

August 1 - September 30, 2023


Dry

Target Flows

  • August 1 - 31 : 800 CFS
  • September 1 - 15 : 800 CFS
  • September 16 - 30 : 600 CFS
Hydrologic Conditions Index
0.11
July 2023

Report period

July 1-31, 2023


Normal

Target Flows

  • July 1 - 31 : 1200 CFS
Hydrologic Conditions Index
0.60
June 2023

Report period

June 1-30, 2023


Dry

Target Flows

  • June 1 - 20 : 800 CFS
  • June 21 - 30 : 800 CFS
Hydrologic Conditions Index
0.29

The monthly Palmer Drought Severity Index (PDSI) values for May reduced the hydrologic condition index from 0.347 to 0.288 and changed the final hydrologic condition from "NORMAL" to "DRY"

May 2023

Report period

May 1-31, 2023


Dry

Target Flows

  • May 1 - 10 : 1700 CFS
  • May 11 - 19 : 800 CFS
  • May 20 - 26 : 800 CFS
  • May 27 - 31 : 800 CFS
Hydrologic Conditions Index
0.21
March-April 2023

Report period

March 1 - April 30, 2023


Dry

Target Flows

  • March 1 - 15 : 2250 CFS
  • March 16 - 22 : 1200 CFS
  • March 23 - 31 : 1700 CFS
  • April 1 - 30 : 1700 CFS
Hydrologic Conditions Index
0.12

The monthly Palmer Drought Severity Index (PDSI) values for February reduced the hydrologic condition index from 0.433 to 0.118 and changed the final hydrologic condition from "NORMAL" to "DRY"

December 2022-February 2023

Report period

December 1, 2022 - February 28, 2023


Dry

Target Flows

  • December 1 - 31 : 600 CFS
  • January 1 - 31 : 600 CFS
  • February 1 - 14 : 1200 CFS
  • February 15 - 28 : 2250 CFS
Hydrologic Conditions Index
0.22
October-November 2022

Report period

October 1 - November 30, 2022


Dry

Target Flows

  • October 1 - 31 : 1300 CFS
  • November 1 - 15 : 1300 CFS
  • November 16 - 30 : 600 CFS
Hydrologic Conditions Index
0.02
August-September 2022

Report period

August 1 - September 30, 2022


Dry

Target Flows

  • August 1 - 31 : 800 CFS
  • September 1 - 15 : 800 CFS
  • September 16 - 30 : 600 CFS
Hydrologic Conditions Index
0.10
July 2022

Report period

July 1-31, 2022


Dry

Target Flows

  • July 1 - 31 : 800 CFS
Hydrologic Conditions Index
0.14
June 2022

Report period

June 1-30, 2022


Dry

Target Flows

  • June 1 - 20 : 800 CFS
  • June 21 - 30 : 800 CFS
Hydrologic Conditions Index
0.23
May 2022

Report period

May 1-31, 2022


Dry

Target Flows

  • May 1 - 10 : 1700 CFS
  • May 11 - 19 : 800 CFS
  • May 20 - 26 : 800 CFS
  • May 27 - 31 : 800 CFS
Hydrologic Conditions Index
0.07
March-April 2022

Report period

March 1 - April 30, 2022


Dry

Target Flows

  • March 1 - 15 : 2250 CFS
  • March 16 - 22 : 1200 CFS
  • March 23 - 31 : 1700 CFS
  • April 1 - 30 : 1700 CFS
Hydrologic Conditions Index
0.12

The monthly Palmer Drought Severity Index (PDSI) values for February reduced the hydrologic condition index from 0.432 to 0.118 and changed the final hydrologic condition from "NORMAL" to "DRY"

December 2021-February 2022

Report period

December 1, 2021 - February 28, 2022


Normal

Target Flows

  • December 1 - 31 : 1000 CFS
  • January 1 - 31 : 1000 CFS
  • February 1 - 14 : 1800 CFS
  • February 15 - 28 : 3350 CFS
Hydrologic Conditions Index
0.42
October-November 2021

Report period

October 1 - November 30, 2021


Normal

Target Flows

  • October 1 - 31 : 1800 CFS
  • November 1 - 15 : 1800 CFS
  • November 16 - 30 : 1000 CFS
Hydrologic Conditions Index
0.30
August-September 2021

Report period

August 1 - September 30, 2021


Normal

Target Flows

  • August 1 - 31 : 1200 CFS
  • September 1 - 15 : 1200 CFS
  • September 16 - 30 : 1000 CFS
Hydrologic Conditions Index
0.36

The monthly Palmer Drought Severity Index (PDSI) values for July increased the hydrologic condition index from 0.216 to 0.355 and changed the final hydrologic condition from "DRY" to "NORMAL"

July 2021

Report period

July 1-31, 2021


Dry

Target Flows

  • July 1 - 31 : 800 CFS
Hydrologic Conditions Index
0.30

The monthly Palmer Drought Severity Index (PDSI) values for June reduced the hydrologic condition index from 0.433 to 0.295 and changed the final hydrologic condition from "NORMAL" to "DRY"

June 2021

Report period

June 1-30, 2021


Normal

Target Flows

  • June 1 - 20 : 3400 CFS
  • June 21 - 30 : 1200 CFS
Hydrologic Conditions Index
0.43
May 2021

Report period

May 1-31, 2021


Dry

Target Flows

  • May 1 - 10 : 1700 CFS
  • May 11 - 19 : 800 CFS
  • May 20 - 26 : 800 CFS
  • May 27 - 31 : 800 CFS
Hydrologic Conditions Index
0.28
March-April 2021

Report period

March 1 - April 30, 2021


Dry

Target Flows

  • March 1 - 15 : 2250 CFS
  • March 16 - 22 : 1200 CFS
  • March 23 - 31 : 1700 CFS
  • April 1 - 30 : 1700 CFS
Hydrologic Conditions Index
0.22

The monthly Palmer Drought Severity Index (PDSI) values for February reduced the hydrologic condition index to 0.218 and changed the final hydrologic condition from "NORMAL" to "DRY"

December-January-February 2020-2021

Report period

December 1, 2020 - February 28, 2021


Normal

Target Flows

  • December 1 - 31 : 1000 CFS
  • January 1 - 31 : 1000 CFS
  • February 1 - 14 : 1800 CFS
  • February 15 - 28 : 3350 CFS
October-November 2020

Report period

October 1 - November 30, 2020


Normal

Target Flows

  • October 1 - 31 : 1800 CFS
  • November 1 - 15 : 1800 CFS
  • November 16 - 30 : 1000 CFS
August-September 2020

Report period

August 1 - September 30, 2020


Normal

Target Flows

  • August 1 - 31 : 1200 CFS
  • September 1 - 15 : 1200 CFS
  • September 16 - 30 : 1000 CFS
Hydrologic Conditions Index
0.54
July 2020

Report period

July 1-31, 2020


Normal

Target Flows

  • July 1 - 31 : 1200 CFS
June 2020

Report period

June 1-30, 2020


Wet

Target Flows

  • June 1 - 20 : 3400 CFS
  • June 21 - 30 : 1200 CFS
May 2020

Report period

May 1 - June 1, 2020


Wet

Target Flows

  • May 1 - 10 : 2400 CFS
  • May 11 - 19 : 1200 CFS
  • May 20 - 26 : 4900 CFS
  • May 27 - 31 : 3400 CFS
Hydrologic Conditions Index
0.92
March-April 2020

Report period

March 1 - April 30, 2020


Normal

Target Flows

  • March 1 - 15 : 3350 CFS
  • March 16 - 22 : 1800 CFS
  • March 23 - 31 : 2400 CFS
  • April 1 - 30 : 2400 CFS
December-January-February 2020

Report period

December 1, 2019 - February 29, 2020


Normal

Target Flows

  • December 1 - 31 : 1000 CFS
  • January 1 - 31 : 1000 CFS
  • February 1 - 14 : 1800 CFS
  • February 15 - 29 : 3350 CFS
October-November 2019

Report period

October 1 - November 30, 2019


Wet

Target Flows

  • October 1 - 31 : 2400 CFS
  • November 1 - 15 : 2400 CFS
  • November 16 - 30 : 1000 CFS
August-September 2019

Report period

August 1 - September 30, 2019


Normal

Target Flows

  • August 1 - 31 : 1200 CFS
  • September 1 - 15 : 1200 CFS
  • September 16 - 30 : 1000 CFS
July 2019

Report period

July 1-31, 2019


Normal

Target Flows

  • July 1 - 31 : 1200 CFS
June 2019

Report period

June 1-30, 2019


Wet

Target Flows

  • June 1 - 20 : 3400 CFS
  • June 21 - 30 : 1200 CFS
May 2019

Report period

May 1-31, 2019


Wet

Target Flows

  • May 1 - 10 : 2400 CFS
  • May 11 - 19 : 1200 CFS
  • May 20 - 26 : 4900 CFS
  • May 27 - 31 : 3400 CFS
March-April 2018

Report period

March 1 - April 30, 2019


Normal

Target Flows

  • March 1 - 15 : 3350 CFS
  • March 16 - 22 : 1800 CFS
  • March 23 - 31 : 2400 CFS
  • April 1 - 30 : 2400 CFS
December 2018 to February 2019

Report period

December 1, 2018 - February 28, 2019


Normal

Target Flows

  • December 1 - 31 : 1000 CFS
  • January 1 - 31 : 1000 CFS
  • February 1 - 14 : 1800 CFS
  • February 15 - 28 : 3350 CFS
October and November 2018

Report period

October 1 - November 30, 2018


Normal

Target Flows

  • October 1 - 31 : 1800 CFS
  • November 1 - 15 : 1800 CFS
  • November 16 - 30 : 1000 CFS
August and September 2018

Report period

August 1 - September 30, 2018


Normal

Target Flows

  • August 1 - 31 : 1200 CFS
  • September 1 - 15 : 1200 CFS
  • September 16 - 30 : 1000 CFS

Variables and Values

  1. The mean July Palmer Drought Severity Index for two climate stations in Nebraska (NCDC Nebraska Divisions 5 and 8) was 1.32 equivalent to 45.3% of the 1947-1994 July conditions.

  2. The July end-of-month content in Lake McConaughy as a percent of total capacity was 83.1%, equivalent to the 44.5% level of July end-of-month content over the 1947-1994 period.

Hydrologic Conditions Index
0.55

For this period, the threshold index value is 0.29 for "normal" conditions. The current index value is greater than this and constitutes "NORMAL" conditions.
 
Note that for the August-September period, there are only "dry" and "normal" designations because "wet" targets are the same as "normal" targets for this period.

Hydrologic Conditions Calculation
Hydrologic Conditions Calculation: (0.464 * 0.453) + (0.404 * 0.445) + 0.061=0.451
July 2018

Report period

July 1-31, 2018


Normal

Target Flows

  • July 1 - 31 : 1200 CFS
June 2018

Report period

June 1-30, 2018


Normal

Target Flows

  • June 1 - 20 : 3400 CFS
  • June 21 - 30 : 1200 CFS

Variables and Values

  1. To set the hydrologic condition for June, an index of conditions is computed using four Platte basin variables. These variables and their corresponding values were as follows:

    1. The mean May streamflow in the Platte River at Grand Island was 1,883 cfs (provisional USGS data), or at the 62.6 percentile level of 1947-1994 April flows.
    2. The mean May Palmer Drought Severity Index for four zones (NCDC climate divisions Colorado #1, Wyoming #8, and Nebraska #1 and #7) was 2.13* equivalent to the 81.7 percentile level of 1947-1994 May conditions.
    3. The mean May streamflow in the South Platte River at Julesburg (CO-NE stateline) was 412 cfs (provisional data), equivalent to 59.9 percentile of 1947-1994 May flows.
    4. The April 1 percent-of-normal snowpack in the North Platte Basin of Wyoming* (seven specific NRCS locations) was 101.4% of normal, equivalent to the 58.3 percentile level of 1947-1994 conditions. 
Hydrologic Conditions Index
0.66

For this period, the threshold index value is 0.30 for "normal" conditions and 0.70 for "wet" conditions. The current index value is greater than 0.30 and less than 0.70 and constitutes "???" conditions.

*based on temporary weekly PDSI data, to be updated when monthly PDSI data is available.

Hydrologic Conditions Calculation
Hydrologic Conditions Index = (0.648 * 0.626) + (0.121 * 0.817) + (0.023 * 0.599) + (0.082 * 0.583) + 0.097
May 2018

Report period

May 1-31, 2018


Normal

Target Flows

  • May 1 - 10 : 2400 CFS
  • May 11 - 19 : 1200 CFS
  • May 20 - 26 : 3400 CFS
  • May 27 - 31 : 3400 CFS

Variables and Values

  1. The mean April streamflow in the Platte River at Grand Island was 2,055 cfs (provisional USGS data), or at the 62.9 percentile level of 1947-1994 April flows.

  2. The April end-of-month content of Lake McConaughy was 1,467,900 acre-feet, equivalent to 84.2% of maximum capacity and 25.7 percentile level of the 1947-1994 April percent-of-capacity.

  3. The April end-of-month content of three upper South Platte reservoirs (Antero, Eleven-Mile, and Cheesman) was 186,525 acre-feet, equivalent to the 68.7 percentile level of their 1947-1994 April contents.

  4. The April 1 percent-of-normal snowpack in the North Platte Basin of Wyoming* (seven specific NRCS locations) was 101.4% of normal, equivalent to the 62.2 percentile level of 1947-1994 conditions.

Hydrologic Conditions Index
0.56

The threshold index value is 0.30 for "normal" conditions and 0.70 for "wet" conditions. The current index value is greater than 0.30 and less than 0.70 and constitutes "NORMAL" condition.

Hydrologic Conditions Calculation
(0.601 * 0.629) + (0.271 * 0.257) + (0.031 * 0.687) + (0.252 * 0.622) - 0.065
March-April 2018

Report period

March 1 - April 30, 2018


Normal

Target Flows

  • March 1 - 15 : 3350 CFS
  • March 16 - 22 : 1800 CFS
  • March 23 - 31 : 2400 CFS
  • April 1 - 30 : 2400 CFS

Variables and Values

  1. The mean February streamflow for the Platte River near Grand Island gage (provisional USGS data) was 1,710* cubic feet per second, equivalent to the 51.3 percentile level of 1947-1994 February conditions. (*The USGS streamflow gage at Grand Island reported "ICE" conditions for the entirety of February.  Data from the Overton gage was used as a surrogate)

  2. The mean February Palmer Drought Severity Index for four climate zones in three states (NCDC divisions Colorado #4, Wyoming #8, and Nebraska #1 and #7) was -0.52, equivalent to the 45.6 percentile level of 1947-1994 February conditions.

  3. The February end-of-month content of seven North Platte reservoirs (Alcova, Glendo, Gray Reef, Guernsey, Kortes, Pathfinder, and Seminoe) was approximately 2,125,352 acre-feet, equivalent to the 97.1 percentile level of 1947-1994 end-of-month February conditions.

Hydrologic Conditions Index
0.55

For this period, the threshold index value is 0.25 for "normal" conditions. The current index value is less than this and constitutes "NORMAL" conditions.
 
Note that for the March-April period, there are only "dry" and "normal" designations because "wet" targets are the same as "normal" targets for this period.

Hydrologic Conditions Calculation
(0.120 * 0.513) + (0.662 * 0.456) + (0.198 * 0.971) - 0.011